Trading charts
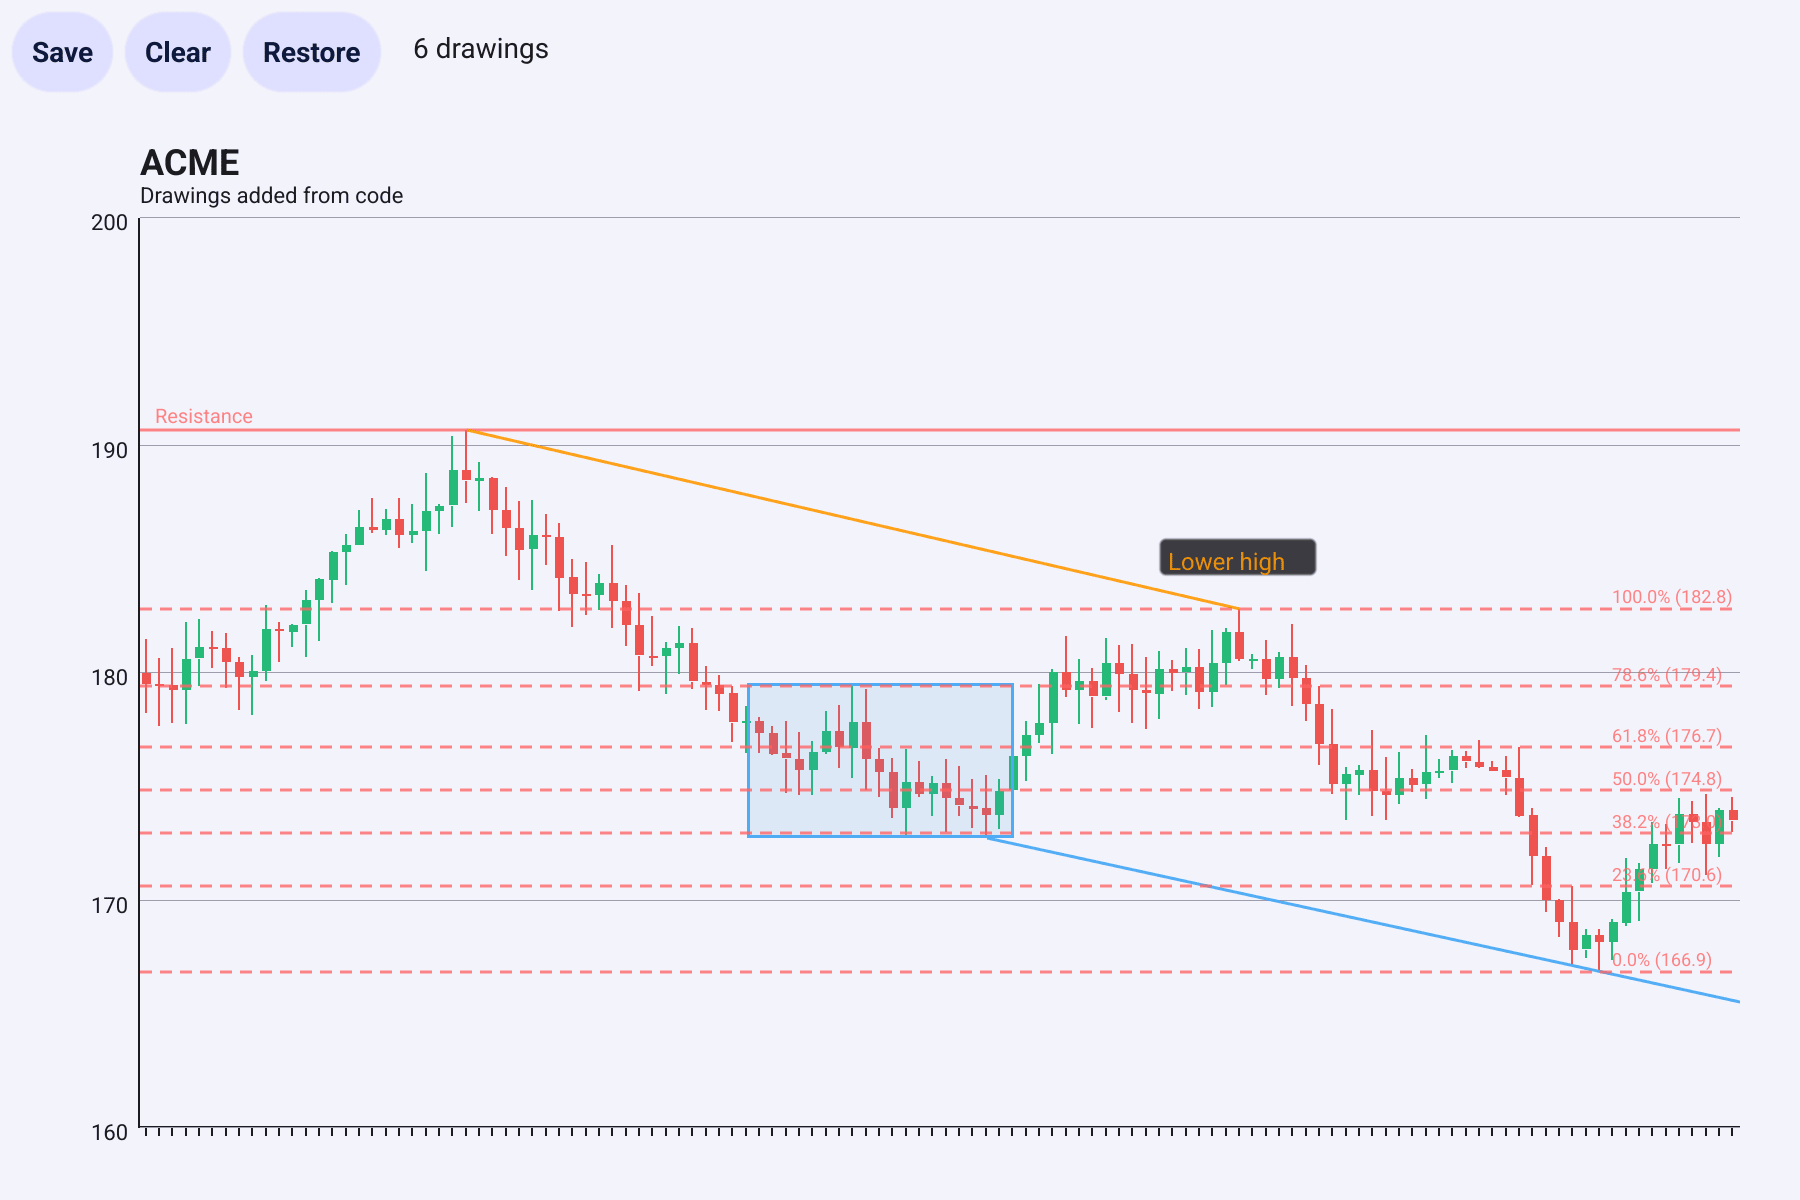
This page builds the kind of chart a trading app shows: candlesticks with moving averages, a volume pane underneath that zooms and hovers together with the prices, a crosshair with value tags on the axes, and tools the user draws with, such as trend lines, horizontal levels and Fibonacci retracements. It also shows how to create drawings from code and how to save and restore them.
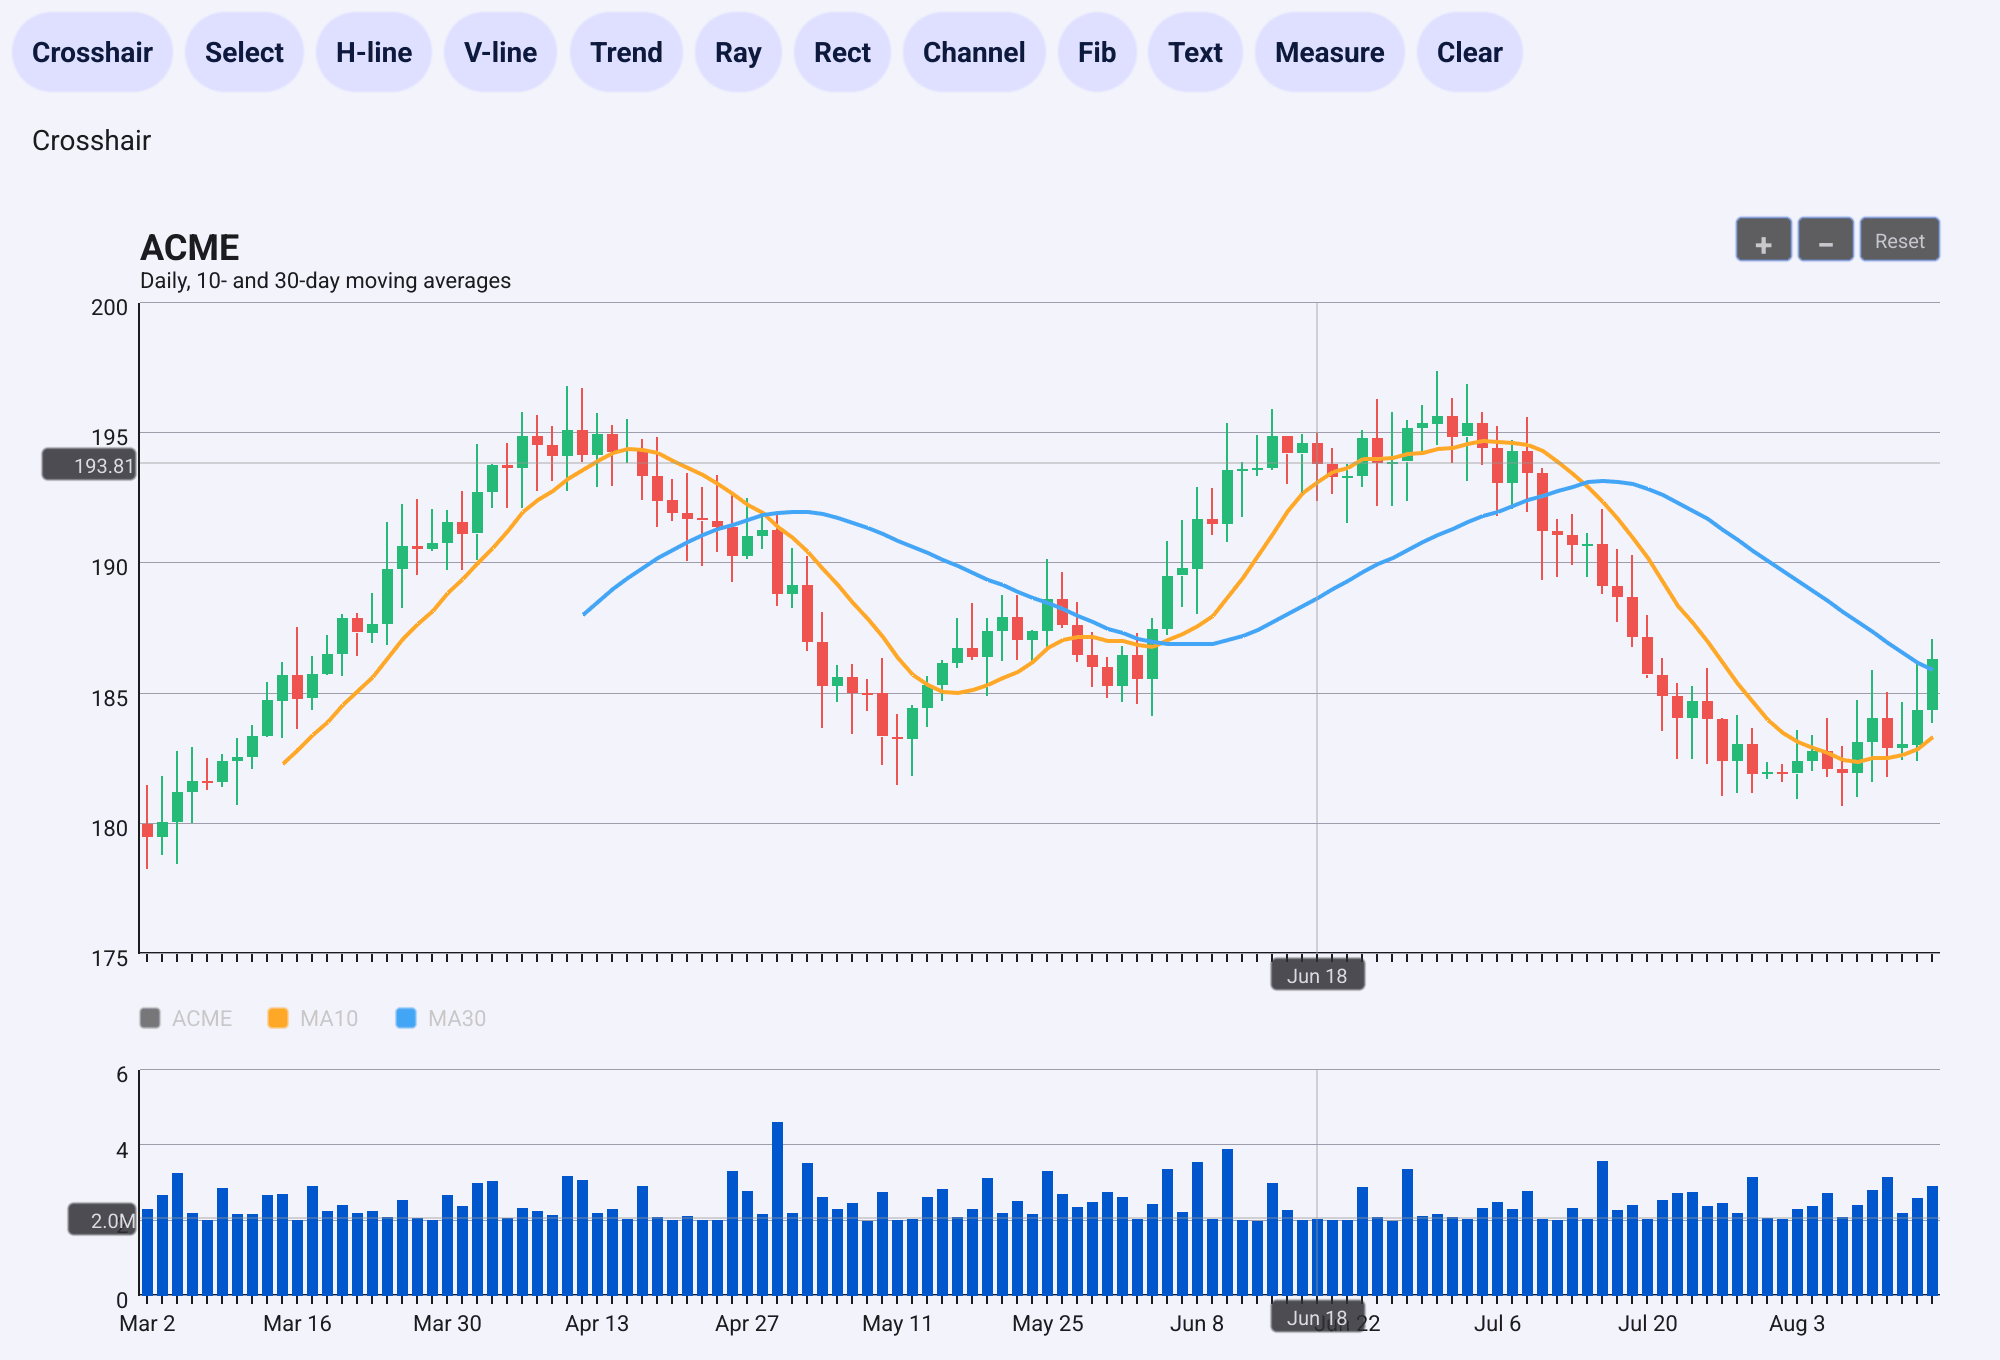
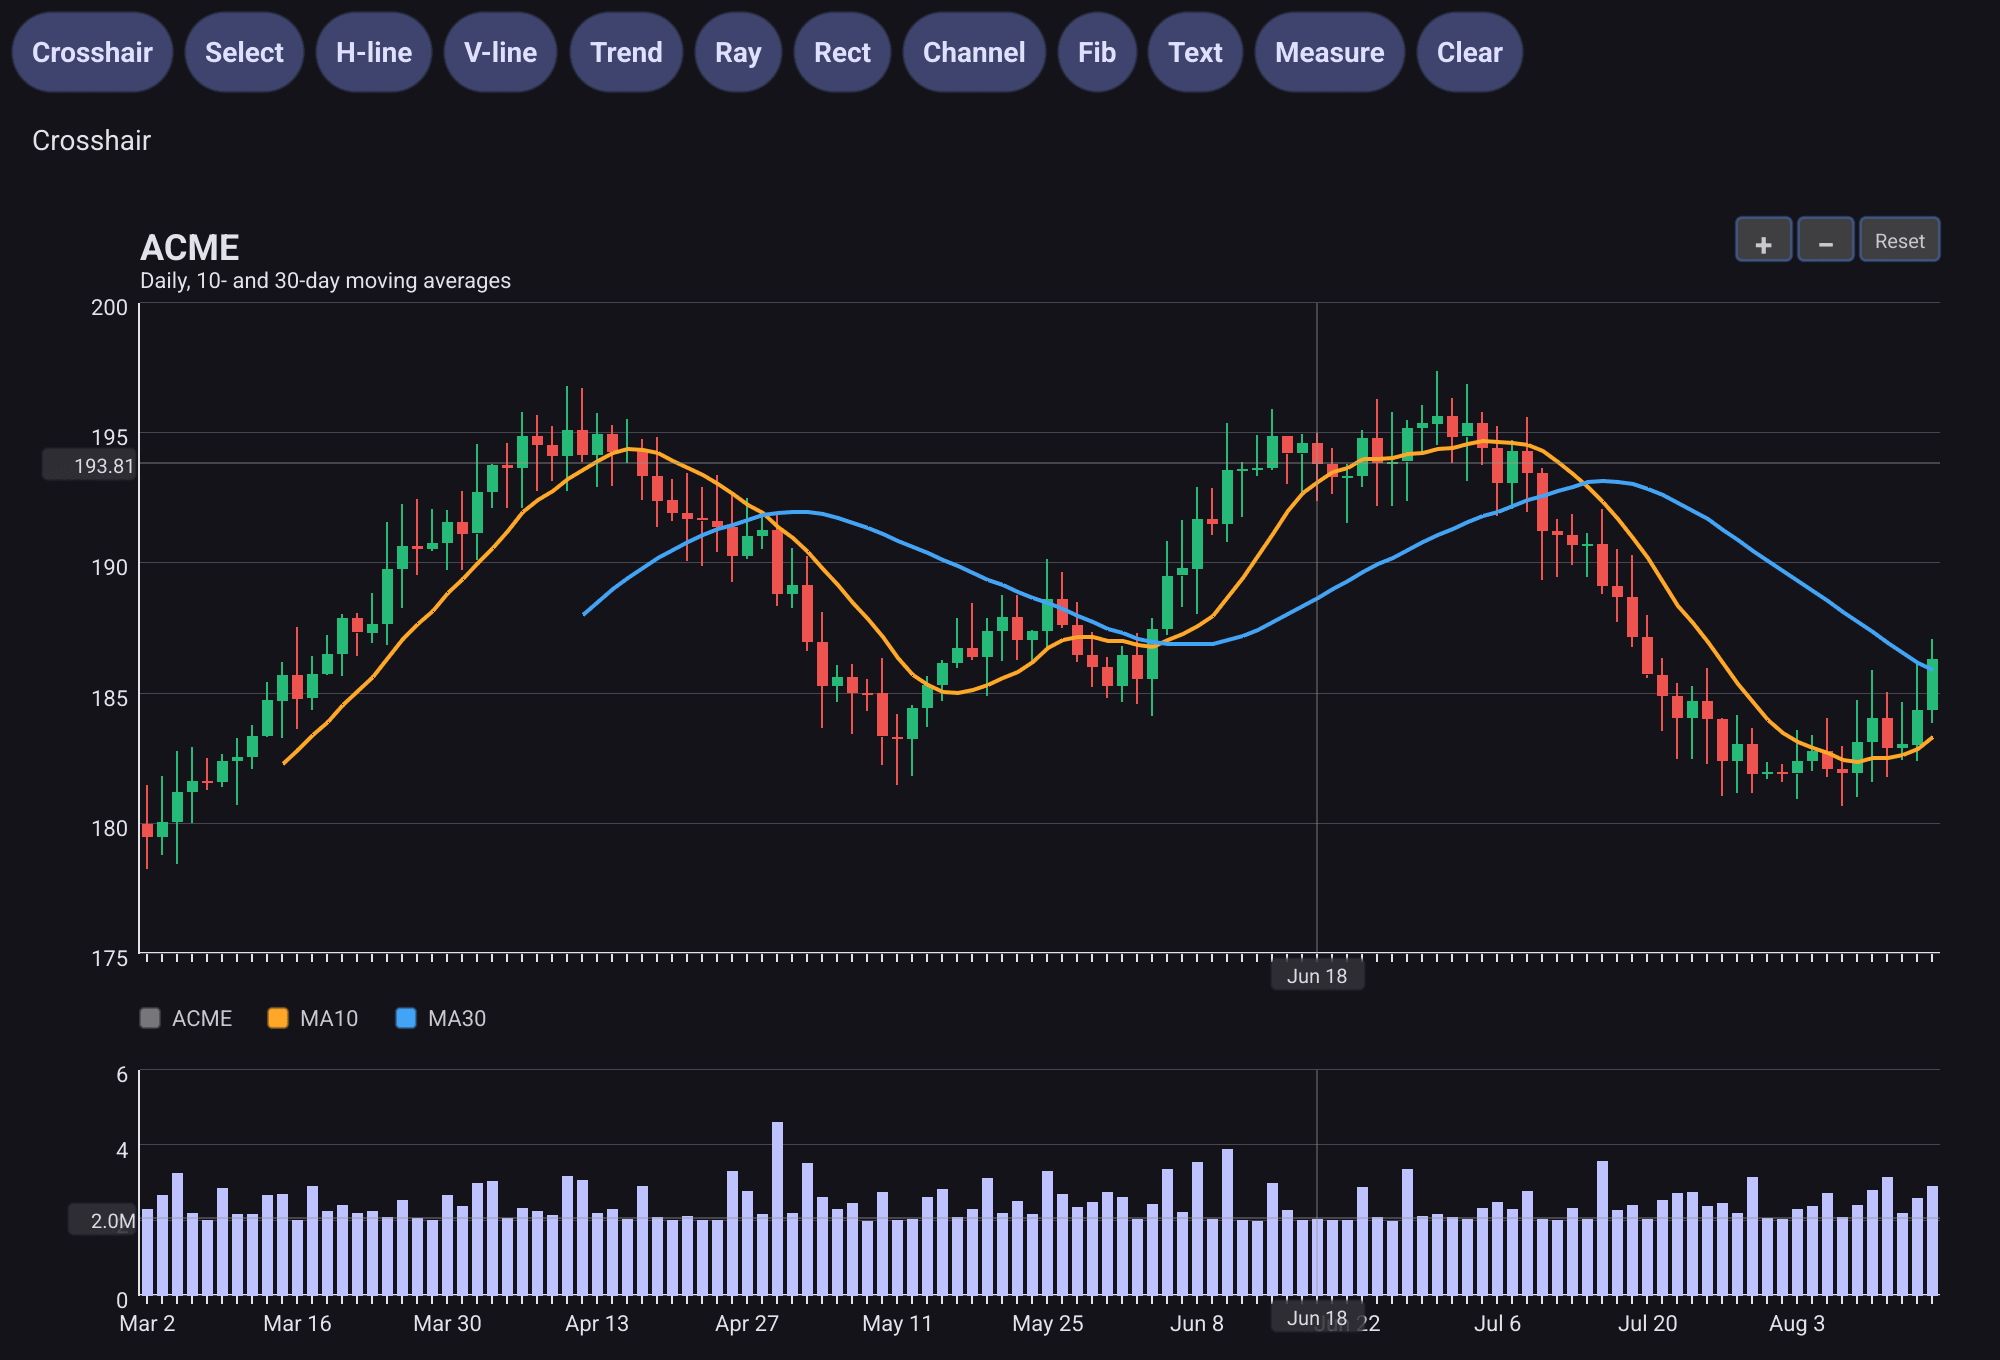
The sections below show the program in parts; the whole program is at the end of the page.
Price and volume panes
A chart.ChartGroup
stacks several charts on top of each other and keeps them in step. Each
Pane
holds a chart and a relative Height: with heights 3 and 1, the price pane
takes three quarters of the space.
// crosshair builds the hover behaviour both panes share: crosshair lines
// with value tags on the axes, and a text box only when the user clicks.
crosshair := func(yTag string, text func(i int) string) *component.TooltipConfig {
	return &component.TooltipConfig{
		Trigger:       component.TooltipTriggerAxis,
		Crosshair:     component.CrosshairBoth,
		CrosshairOnly: true, // no text box while hovering; click to pin one
		ShowAxisTags:  true, // value tags where the crosshair meets the axes
		AxisTagFormatter: func(x, y float64) (string, string) {
			i := int(math.Round(x))
			if i < 0 || i >= len(dates) {
				return "", ""
			}
			return dates[i], fmt.Sprintf(yTag, y)
		},
		Formatter: func(hits []interact.HitResult) string {
			return text(hits[0].DataIndex)
		},
	}
}
priceTip := crosshair("%.2f", func(i int) string {
	c := candles[i]
	return fmt.Sprintf("%s\nO %.2f  H %.2f\nL %.2f  C %.2f", dates[i], c.Open, c.High, c.Low, c.Close)
})
volTip := crosshair("%.1fM", func(i int) string {
	return fmt.Sprintf("%s\nVolume %.1fM", dates[i], volume[i])
})
grid := func(top, bottom float32) *chart.Grid {
	// Same left and right margins in every pane, so the plots line up.
	return &chart.Grid{Left: 64, Right: 24, Top: top, Bottom: bottom}
}

// Axis tooltips only find line-like series, not candles or bars, so each
// pane carries an invisible line through the values to hover on.
hidden := series.LineStyle{Color: color.Transparent}
closes := make([]float64, len(candles))
for i, c := range candles {
	closes[i] = c.Close
}

price := chart.New(chart.Option{
	Title:    &chart.Title{Text: "ACME", SubText: "Daily, 10- and 30-day moving averages"},
	Tooltip:  priceTip,
	DataZoom: &interact.ZoomConfig{Enabled: true, MinSpan: 0.1, MaxSpan: 1, ZoomSensitivity: 0.08},
	Grid:     grid(12, 30),
	Color: []color.Color{
		color.NRGBA{R: 120, G: 120, B: 120, A: 255}, // legend swatch for the candles
		color.Transparent,
		color.NRGBA{R: 255, G: 167, B: 38, A: 255}, // MA10
		color.NRGBA{R: 66, G: 165, B: 245, A: 255}, // MA30
	},
	XAxis: []axis.Config{{Type: axis.TypeCategory, Data: make([]string, len(dates))}},
	YAxis: []axis.Config{{Type: axis.TypeValue, SplitCount: 5}},
	Series: []series.Series{
		&series.CandlestickSeries{SeriesName: "ACME", Data: candles, BarWidth: 0.7},
		&series.LineSeries{Data: closes, LineStyle: hidden}, // no name: not in the legend
		&series.LineSeries{SeriesName: "MA10", Data: movingAverage(candles, 10)},
		&series.LineSeries{SeriesName: "MA30", Data: movingAverage(candles, 30)},
	},
})

vol := chart.New(chart.Option{
	Tooltip: volTip,
	// Enabled: false gives the pane a zoom window that follows the group,
	// without its own zoom buttons.
	DataZoom: &interact.ZoomConfig{Enabled: false, MinSpan: 0.1, MaxSpan: 1},
	Grid:     grid(6, 26),
	XAxis:    []axis.Config{{Type: axis.TypeCategory, Data: sparse}},
	YAxis:    []axis.Config{{Type: axis.TypeValue, SplitCount: 2}},
	Series: []series.Series{
		&series.BarSeries{Data: volume, BarWidth: 0.7},
		&series.LineSeries{Data: volume, LineStyle: hidden},
	},
})

group := chart.NewChartGroup(
	chart.Pane{Chart: price, Height: 3},
	chart.Pane{Chart: vol, Height: 1},
)
The group does two things:
- Zoom and pan. When the user zooms or pans one pane, with the wheel, a drag
or the zoom buttons, the group sets the same zoom window on the other panes.
A pane only follows if it has a
DataZoom. Give it one withEnabled: false, as the volume pane does: it then follows the group but has no zoom buttons and ignores the wheel. - Hover. When the pointer moves over one pane, the other panes show their crosshair at the same X position.
The panes line up only if you make them line up. Give every pane the same
number of categories and the same Grid.Left and Grid.Right margins, so the
plots have the same width and a category sits at the same X in each pane.
SetSyncEnabled(false) switches the syncing off. The group syncs only zoom
changes the user makes: when you call SetZoomWindow from code, call it on
every pane.
Moving averages
A moving average is an ordinary LineSeries on the same axes as the candles.
Leave the first values, where the average is not defined yet, as NaN: the
line starts where the data does.
// movingAverage returns the simple moving average of the closes over n days.
// The first n-1 values are NaN, which a line series leaves undrawn.
func movingAverage(candles []series.CandlestickData, n int) []float64 {
	out := make([]float64, len(candles))
	sum := 0.0
	for i, c := range candles {
		sum += c.Close
		if i >= n {
			sum -= candles[i-n].Close
		}
		if i < n-1 {
			out[i] = math.NaN()
		} else {
			out[i] = sum / float64(n)
		}
	}
	return out
}
Option.Color gives the averages their colours. The candles use their own
UpColor and DownColor (green and red by default), so the palette entry at
their index only colours their legend swatch.
Crosshair and axis tags
The tooltip settings in the example are the ones that suit a price chart:
Trigger: TooltipTriggerAxisfinds the data at the pointer’s X position.Crosshair: CrosshairBothdraws a vertical and a horizontal line through it.ShowAxisTagsputs a tag with the X and Y values where the lines meet the axes, andAxisTagFormatterwrites those values. Here it turns the category index into a date.CrosshairOnlyhides the text box while hovering. A click pins the box, filled in byFormatter; a second click, or 15 seconds (PinDuration), removes it.
Zooming
With DataZoom enabled, the wheel zooms around the pointer, a drag pans once
you are zoomed in, and the +, − and Reset buttons sit at the top
right of the pane. Zoom has the details. Three things
matter for price charts in v1.0.0:
- The Y axis keeps the range of all the data. Zooming into a quiet week does not stretch it to fill the pane.
- Candles and bars keep the width they have when all the data is shown, so they look thin when you zoom in far.
- A category axis writes a label under every category. With 120 days that is unreadable, so the example passes a label for every tenth day and empty strings for the rest.
To add candles as they arrive, see Live data. In a group, append to every pane, including the hidden lines, so the panes keep the same number of points.
Drawing tools
The user draws on a chart after you switch a tool on with
SetDrawingTool.
There is no built-in toolbar: you make one from your own buttons.
// setTooltip swaps the price pane's tooltip, keeping the rest of its option.
setTooltip := func(cfg *component.TooltipConfig) {
	opt := price.Option()
	opt.Tooltip = cfg
	price.SetOption(opt)
}
noTooltip := &component.TooltipConfig{Trigger: component.TooltipTriggerNone}

// Crosshair: plain viewing. Select: click a drawing to select it, drag it
// to move it, press Delete to remove it. A click on a chart that shows a
// tooltip pins the tooltip instead of selecting, so Select turns it off.
crosshairMode := func() {
	price.SetDrawingTool(interact.DrawingToolNone)
	setTooltip(priceTip)
	status.SetText("Crosshair")
}
selectMode := func() {
	price.SetDrawingTool(interact.DrawingToolNone)
	setTooltip(noTooltip)
	status.SetText("Select: click a drawing, drag to move, Delete to remove")
}
bar := container.NewHBox(
	widget.NewButton("Crosshair", crosshairMode),
	widget.NewButton("Select", selectMode),
)
tools := []struct {
	label string
	tool  interact.DrawingToolMode
}{
	{"H-line", interact.DrawingToolHLine},
	{"V-line", interact.DrawingToolVLine},
	{"Trend", interact.DrawingToolTrendLine},
	{"Ray", interact.DrawingToolRay},
	{"Rect", interact.DrawingToolRectangle},
	{"Channel", interact.DrawingToolChannel},
	{"Fib", interact.DrawingToolFibRetracement},
	{"Text", interact.DrawingToolTextLabel},
	{"Measure", interact.DrawingToolMeasure},
}
for _, t := range tools {
	bar.Add(widget.NewButton(t.label, func() {
		setTooltip(priceTip)
		price.SetDrawingTool(t.tool)
		status.SetText("Tool: " + t.label)
	}))
}
bar.Add(widget.NewButton("Clear", price.ClearDrawings))
These are all the tools in v1.0.0, the
interact.DrawingToolMode
values:
| Tool | How the user draws it | Stored as |
|---|---|---|
DrawingToolHLine | One click; a horizontal line across the plot at that price | HLineDrawing |
DrawingToolVLine | One click; a vertical line at that point in time | VLineDrawing |
DrawingToolTrendLine | Two clicks; a segment between them | TrendLineDrawing |
DrawingToolRay | Two clicks; a line from the first through the second, to the edge of the plot | RayDrawing |
DrawingToolRectangle | Two clicks on opposite corners; a shaded box | RectangleDrawing |
DrawingToolChannel | Three clicks: two for a line, a third for the parallel line | ChannelDrawing |
DrawingToolFibRetracement | Two clicks, at the high and the low; dashed lines at 0, 23.6, 38.2, 50, 61.8, 78.6 and 100 % with their prices | FibRetracementDrawing |
DrawingToolTextLabel | One click, then type; Enter or another click finishes | TextLabelDrawing |
DrawingToolMeasure | Drag; shows the change in X, in price and in percent while you drag | nothing: it disappears when you let go |
DrawingToolNone | Switches drawing off |
While a two- or three-click drawing is in progress, a preview follows the pointer. A new drawing takes its colour from a fixed set of six, picked by how many drawings the chart already has.
A tool stays active after a drawing is finished, so the user can draw several in a row. The example switches back to selecting after each one.
Selecting, moving and deleting
With no tool active, a click within 10 pixels of a drawing selects it: it is drawn thicker, with square handles at its points. Dragging a selected drawing moves it. Delete or Backspace removes it, and Escape deselects it, or cancels a drawing that is still in progress. The chart takes keyboard focus when it is clicked, so these keys work right after a click.
TooltipTriggerNone while the user edits drawings,
and puts the crosshair back for the drawing tools. Clicks with a drawing tool
active are not affected.Events
price.Events.On(interact.EventDrawingCreated, func(evt interface{}) {
	e := evt.(interact.DrawingEvent)
	// Tools stay active after a drawing. The new drawing is selected,
	// so switch to Select mode to let the user move or delete it.
	selectMode()
	status.SetText(fmt.Sprintf("Created %s at %v", e.DrawingID, e.Drawing.DataPoints()))
})
price.Events.On(interact.EventDrawingSelected, func(evt interface{}) {
	status.SetText(fmt.Sprintf("Selected %s", evt.(interact.DrawingEvent).DrawingID))
})
price.Events.On(interact.EventDrawingDeleted, func(evt interface{}) {
	status.SetText(fmt.Sprintf("Deleted %s", evt.(interact.DrawingEvent).DrawingID))
})
Each handler receives an
interact.DrawingEvent
with the DrawingID and, for EventDrawingCreated, the Drawing itself:
EventDrawingCreatedfires when the user finishes a drawing. It arrives on the UI thread, so the handler can update widgets.EventDrawingSelectedfires when the user clicks a drawing.EventDrawingDeletedfires when the user presses Delete and when you callRemoveDrawing.
Nothing fires when a drawing is moved, when you call AddDrawing, or when
ClearDrawings removes everything. To keep a saved copy current, save again
when the user is done, for example when the window closes.
Drawings from code
AddDrawing
puts a drawing on the chart without the mouse, for example to mark levels
your app computes. X is the category index, where 0 is the first candle, and Y
is the price.
// X is the category index (0 is the first candle), Y is the price.
high1, high2 := extreme(data, 0, 40, true), extreme(data, 70, 100, true)
low1, low2 := extreme(data, 40, 70, false), extreme(data, 100, 120, false)
orange := color.NRGBA{R: 255, G: 152, B: 0, A: 230}
blue := color.NRGBA{R: 66, G: 165, B: 245, A: 230}

c.AddDrawing(&interact.HLineDrawing{
	DrawingBase: interact.DrawingBase{ID_: "resistance", Label_: "Resistance"},
	Y:           high1.Y,
})
c.AddDrawing(&interact.TrendLineDrawing{
	DrawingBase: interact.DrawingBase{ID_: "highs", Color_: orange},
	Start:       high1,
	End:         high2,
})
c.AddDrawing(&interact.RayDrawing{
	DrawingBase: interact.DrawingBase{ID_: "lows", Color_: blue},
	Start:       low1,
	Direction:   low2, // the ray runs from Start through this point
})
c.AddDrawing(&interact.RectangleDrawing{
	DrawingBase: interact.DrawingBase{ID_: "base", Color_: blue},
	Corner1:     interact.DataPoint{X: 45, Y: extreme(data, 45, 65, true).Y},
	Corner2:     interact.DataPoint{X: 65, Y: extreme(data, 45, 65, false).Y},
})
c.AddDrawing(&interact.FibRetracementDrawing{
	DrawingBase: interact.DrawingBase{ID_: "fib"},
	HighY:       high2.Y,
	LowY:        low2.Y,
	X:           high2.X,
})
c.AddDrawing(&interact.TextLabelDrawing{
	DrawingBase: interact.DrawingBase{ID_: "note", Color_: orange},
	Pos:         interact.DataPoint{X: high2.X - 6, Y: high2.Y + 1.5},
	Text:        "Lower high",
})
Every drawing embeds a
DrawingBase
with an ID_, a Color_ and a Label_. A nil colour uses the default
overlay colour of the theme. The label is written next to the drawing’s
first point. The rest of the fields depend on the type:
| Type | Fields |
|---|---|
HLineDrawing | Y |
VLineDrawing | X |
TrendLineDrawing | Start, End |
RayDrawing | Start, and Direction, a second point the ray passes through |
RectangleDrawing | Corner1, Corner2 |
ChannelDrawing | Line1Start, Line1End, and OffsetY, the price distance to the parallel line |
FibRetracementDrawing | HighY, LowY, and X |
TextLabelDrawing | Pos, Text |
The other methods on the chart are RemoveDrawing(id), ClearDrawings(),
Drawings(), SelectDrawing(id), SelectedDrawing() and DrawingTool().
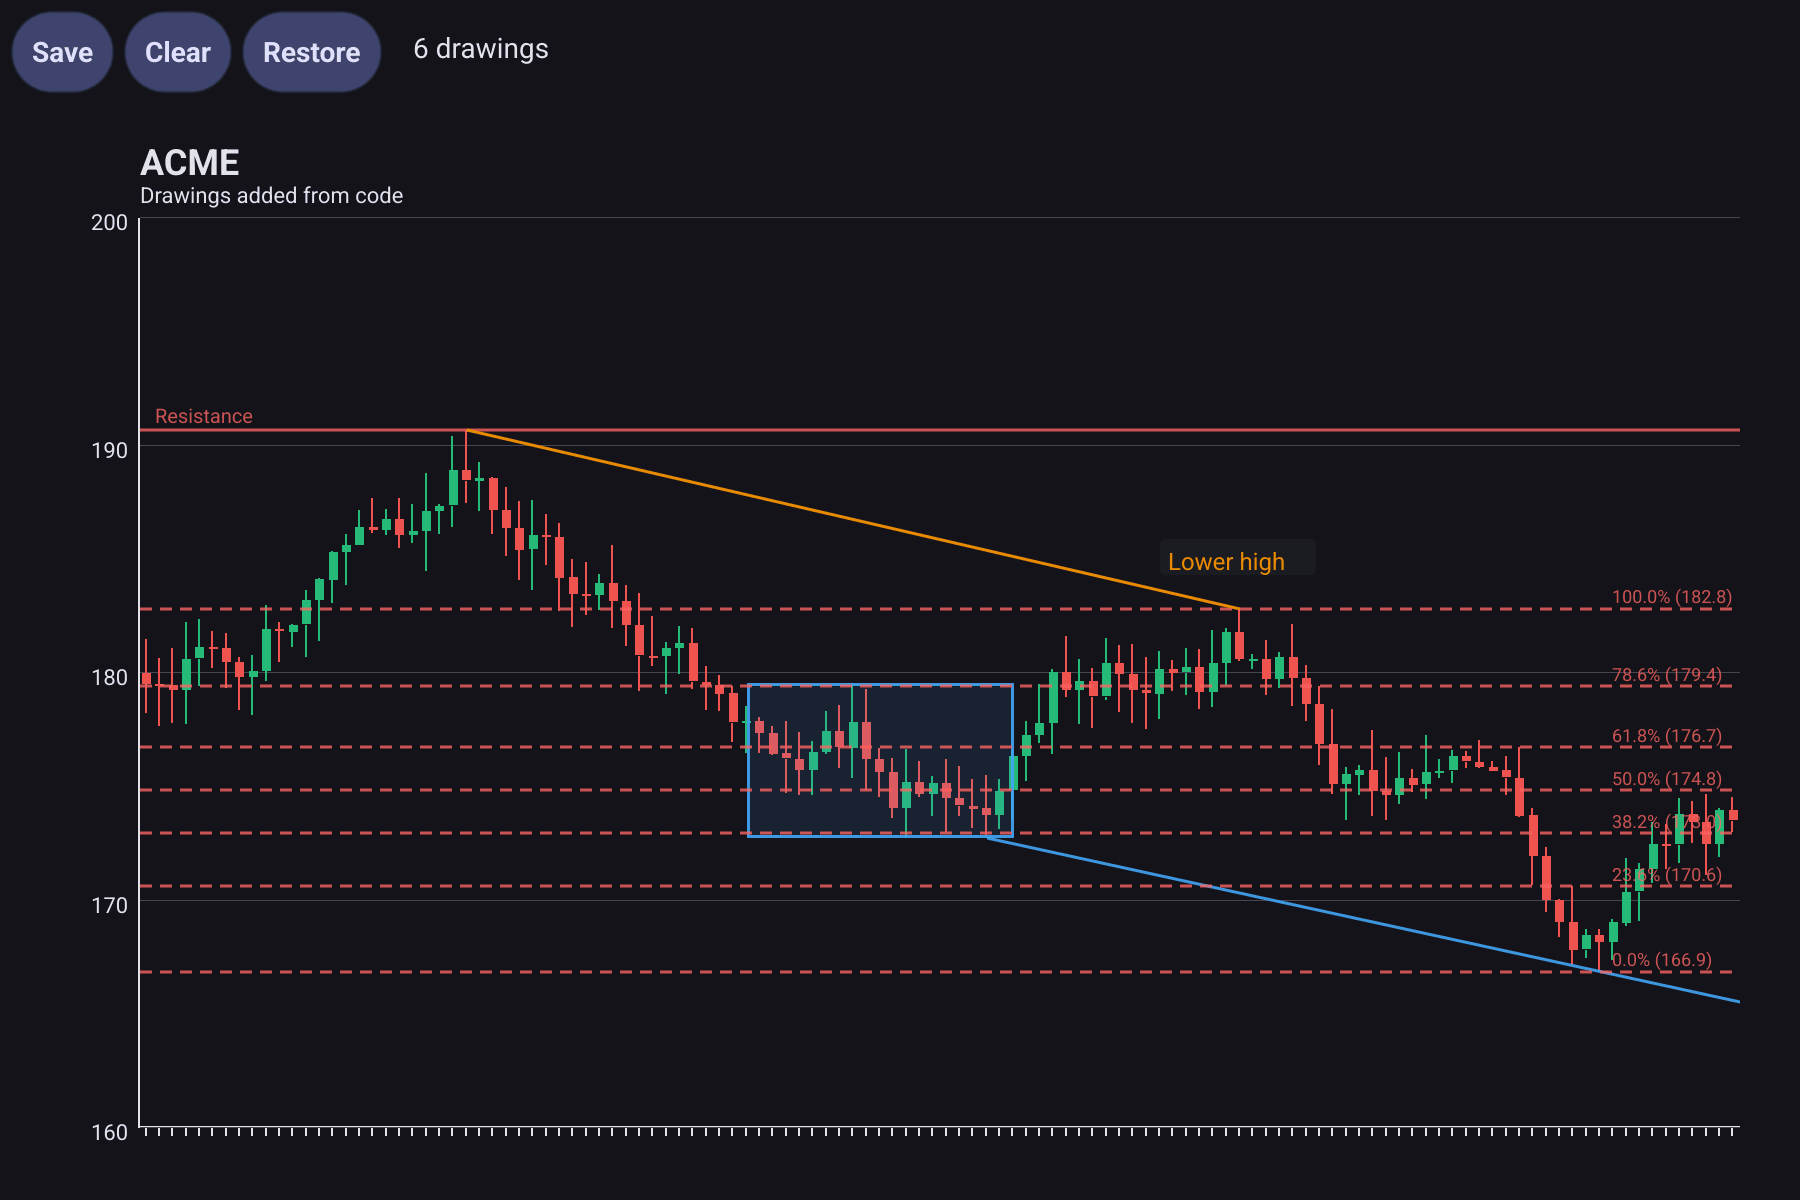
Drawings are measured against the first Y axis. A text label always has a dark background, in both themes.
Saving and restoring drawings
The chart does not save drawings for you. Every drawing can describe itself,
though: Type() says which kind it is, and DataPoints() returns its points
in data coordinates. That is enough to write it out and read it back.
// saved is one drawing in a form that encoding/json can write and read.
type saved struct {
	Tool   interact.DrawingToolMode
	Points []interact.DataPoint
	Label  string      `json:",omitempty"`
	Text   string      `json:",omitempty"` // text labels only
	Color  *color.NRGBA `json:",omitempty"`
}

func save(drawings []interact.Drawing) ([]byte, error) {
	out := make([]saved, 0, len(drawings))
	for _, d := range drawings {
		s := saved{Tool: d.Type(), Points: d.DataPoints(), Label: d.DrawingLabel()}
		if t, ok := d.(*interact.TextLabelDrawing); ok {
			s.Text = t.Text
		}
		if c := d.DrawingColor(); c != nil {
			n := color.NRGBAModel.Convert(c).(color.NRGBA)
			s.Color = &n
		}
		out = append(out, s)
	}
	return json.Marshal(out)
}
To restore, make an empty drawing of the saved type, then hand it the points
with SetDataPoints, which reads them in the same order DataPoints wrote
them:
func restore(data []byte) ([]interact.Drawing, error) {
	var in []saved
	if err := json.Unmarshal(data, &in); err != nil {
		return nil, err
	}
	var out []interact.Drawing
	for i, s := range in {
		// Use IDs of your own: the chart numbers the drawings the user makes
		// "drawing-1", "drawing-2"... and does not skip IDs already in use.
		base := interact.DrawingBase{ID_: interact.DrawingID(fmt.Sprintf("saved-%d", i+1)), Label_: s.Label}
		if s.Color != nil {
			base.Color_ = *s.Color
		}
		var d interact.Drawing
		switch s.Tool {
		case interact.DrawingToolHLine:
			d = &interact.HLineDrawing{DrawingBase: base}
		case interact.DrawingToolVLine:
			d = &interact.VLineDrawing{DrawingBase: base}
		case interact.DrawingToolTrendLine:
			d = &interact.TrendLineDrawing{DrawingBase: base}
		case interact.DrawingToolRay:
			d = &interact.RayDrawing{DrawingBase: base}
		case interact.DrawingToolRectangle:
			d = &interact.RectangleDrawing{DrawingBase: base}
		case interact.DrawingToolChannel:
			d = &interact.ChannelDrawing{DrawingBase: base}
		case interact.DrawingToolFibRetracement:
			d = &interact.FibRetracementDrawing{DrawingBase: base}
		case interact.DrawingToolTextLabel:
			d = &interact.TextLabelDrawing{DrawingBase: base, Text: s.Text}
		default:
			continue
		}
		d.SetDataPoints(s.Points)
		out = append(out, d)
	}
	return out, nil
}
saveBtn := widget.NewButton("Save", func() {
b, err := save(c.Drawings())
if err != nil {
status.SetText(err.Error())
return
}
stored = b // a real app writes this to a file or to preferences
status.SetText(fmt.Sprintf("Saved %d drawings, %d bytes of JSON", len(c.Drawings()), len(b)))
})
clearBtn := widget.NewButton("Clear", func() {
c.ClearDrawings()
status.SetText("Cleared")
})
restoreBtn := widget.NewButton("Restore", func() {
ds, err := restore(stored)
if err != nil {
status.SetText(err.Error())
return
}
c.ClearDrawings()
for _, d := range ds {
c.AddDrawing(d)
}
status.SetText(fmt.Sprintf("Restored %d drawings", len(ds)))
})Things to know when you save drawings:
- Choose your own IDs. The chart names the drawings the user makes
drawing-1,drawing-2and so on, counting from 1 for each chart, and does not look at IDs already in use. A restored drawing calleddrawing-1would share its ID with the next drawing the user makes, andRemoveDrawingwould then remove the wrong one. - Copy before you keep.
Drawings()returns the chart’s own list, and a drag moves a drawing by changing it in place. - X is an index. On a category axis, a saved X is a position in your data. If you later load the data starting from a different day, shift the X values by the same number of days.
- The text of a text label is not one of its points; save
Textseparately, as the example does.
The whole program
charts/trading/main.go
// A trading chart: candlesticks with two moving averages above a volume
// pane, a shared crosshair and zoom, and a toolbar of drawing tools.
package main

import (
	"fmt"
	"image/color"
	"math"
	"math/rand/v2"
	"time"

	"github.com/belluikit/bellui"
	"github.com/belluikit/bellui/app"
	"github.com/belluikit/bellui/container"
	"github.com/belluikit/bellui/geo"
	"github.com/belluikit/bellui/widget"

	"github.com/belluikit/bellui/x/charts/axis"
	"github.com/belluikit/bellui/x/charts/chart"
	"github.com/belluikit/bellui/x/charts/component"
	"github.com/belluikit/bellui/x/charts/interact"
	"github.com/belluikit/bellui/x/charts/series"
)

// market returns n made-up trading days: candles, volumes and date labels.
func market(n int) ([]series.CandlestickData, []float64, []string) {
	r := rand.New(rand.NewPCG(7, 11))
	candles := make([]series.CandlestickData, n)
	volume := make([]float64, n)
	dates := make([]string, n)
	day := time.Date(2026, 3, 2, 0, 0, 0, 0, time.UTC)
	price := 180.0
	for i := range n {
		for day.Weekday() == time.Saturday || day.Weekday() == time.Sunday {
			day = day.AddDate(0, 0, 1)
		}
		dates[i] = day.Format("Jan 2")
		day = day.AddDate(0, 0, 1)

		open := price
		close := open * (1 + 0.004*math.Sin(float64(i)/9) + 0.018*(r.Float64()-0.5))
		high := math.Max(open, close) * (1 + 0.01*r.Float64())
		low := math.Min(open, close) * (1 - 0.01*r.Float64())
		candles[i] = series.CandlestickData{Open: open, High: high, Low: low, Close: close}
		volume[i] = 2 + 6*r.Float64()*math.Abs(close-open)/open*40 // millions
		price = close
	}
	return candles, volume, dates
}

// movingAverage returns the simple moving average of the closes over n days.
// The first n-1 values are NaN, which a line series leaves undrawn.
func movingAverage(candles []series.CandlestickData, n int) []float64 {
	out := make([]float64, len(candles))
	sum := 0.0
	for i, c := range candles {
		sum += c.Close
		if i >= n {
			sum -= candles[i-n].Close
		}
		if i < n-1 {
			out[i] = math.NaN()
		} else {
			out[i] = sum / float64(n)
		}
	}
	return out
}


func main() {
	a := app.New()
	w := a.NewWindow("Trading chart")
	w.Resize(geo.NewSize(1000, 680))

	candles, volume, dates := market(120)

	// A category axis labels every category, so keep one label in ten.
	sparse := make([]string, len(dates))
	for i := range dates {
		if i%10 == 0 {
			sparse[i] = dates[i]
		}
	}

	// crosshair builds the hover behaviour both panes share: crosshair lines
	// with value tags on the axes, and a text box only when the user clicks.
	crosshair := func(yTag string, text func(i int) string) *component.TooltipConfig {
		return &component.TooltipConfig{
			Trigger:       component.TooltipTriggerAxis,
			Crosshair:     component.CrosshairBoth,
			CrosshairOnly: true, // no text box while hovering; click to pin one
			ShowAxisTags:  true, // value tags where the crosshair meets the axes
			AxisTagFormatter: func(x, y float64) (string, string) {
				i := int(math.Round(x))
				if i < 0 || i >= len(dates) {
					return "", ""
				}
				return dates[i], fmt.Sprintf(yTag, y)
			},
			Formatter: func(hits []interact.HitResult) string {
				return text(hits[0].DataIndex)
			},
		}
	}
	priceTip := crosshair("%.2f", func(i int) string {
		c := candles[i]
		return fmt.Sprintf("%s\nO %.2f  H %.2f\nL %.2f  C %.2f", dates[i], c.Open, c.High, c.Low, c.Close)
	})
	volTip := crosshair("%.1fM", func(i int) string {
		return fmt.Sprintf("%s\nVolume %.1fM", dates[i], volume[i])
	})
	grid := func(top, bottom float32) *chart.Grid {
		// Same left and right margins in every pane, so the plots line up.
		return &chart.Grid{Left: 64, Right: 24, Top: top, Bottom: bottom}
	}

	// Axis tooltips only find line-like series, not candles or bars, so each
	// pane carries an invisible line through the values to hover on.
	hidden := series.LineStyle{Color: color.Transparent}
	closes := make([]float64, len(candles))
	for i, c := range candles {
		closes[i] = c.Close
	}

	price := chart.New(chart.Option{
		Title:    &chart.Title{Text: "ACME", SubText: "Daily, 10- and 30-day moving averages"},
		Tooltip:  priceTip,
		DataZoom: &interact.ZoomConfig{Enabled: true, MinSpan: 0.1, MaxSpan: 1, ZoomSensitivity: 0.08},
		Grid:     grid(12, 30),
		Color: []color.Color{
			color.NRGBA{R: 120, G: 120, B: 120, A: 255}, // legend swatch for the candles
			color.Transparent,
			color.NRGBA{R: 255, G: 167, B: 38, A: 255}, // MA10
			color.NRGBA{R: 66, G: 165, B: 245, A: 255}, // MA30
		},
		XAxis: []axis.Config{{Type: axis.TypeCategory, Data: make([]string, len(dates))}},
		YAxis: []axis.Config{{Type: axis.TypeValue, SplitCount: 5}},
		Series: []series.Series{
			&series.CandlestickSeries{SeriesName: "ACME", Data: candles, BarWidth: 0.7},
			&series.LineSeries{Data: closes, LineStyle: hidden}, // no name: not in the legend
			&series.LineSeries{SeriesName: "MA10", Data: movingAverage(candles, 10)},
			&series.LineSeries{SeriesName: "MA30", Data: movingAverage(candles, 30)},
		},
	})

	vol := chart.New(chart.Option{
		Tooltip: volTip,
		// Enabled: false gives the pane a zoom window that follows the group,
		// without its own zoom buttons.
		DataZoom: &interact.ZoomConfig{Enabled: false, MinSpan: 0.1, MaxSpan: 1},
		Grid:     grid(6, 26),
		XAxis:    []axis.Config{{Type: axis.TypeCategory, Data: sparse}},
		YAxis:    []axis.Config{{Type: axis.TypeValue, SplitCount: 2}},
		Series: []series.Series{
			&series.BarSeries{Data: volume, BarWidth: 0.7},
			&series.LineSeries{Data: volume, LineStyle: hidden},
		},
	})

	group := chart.NewChartGroup(
		chart.Pane{Chart: price, Height: 3},
		chart.Pane{Chart: vol, Height: 1},
	)

	status := widget.NewLabel("Crosshair")

	// setTooltip swaps the price pane's tooltip, keeping the rest of its option.
	setTooltip := func(cfg *component.TooltipConfig) {
		opt := price.Option()
		opt.Tooltip = cfg
		price.SetOption(opt)
	}
	noTooltip := &component.TooltipConfig{Trigger: component.TooltipTriggerNone}

	// Crosshair: plain viewing. Select: click a drawing to select it, drag it
	// to move it, press Delete to remove it. A click on a chart that shows a
	// tooltip pins the tooltip instead of selecting, so Select turns it off.
	crosshairMode := func() {
		price.SetDrawingTool(interact.DrawingToolNone)
		setTooltip(priceTip)
		status.SetText("Crosshair")
	}
	selectMode := func() {
		price.SetDrawingTool(interact.DrawingToolNone)
		setTooltip(noTooltip)
		status.SetText("Select: click a drawing, drag to move, Delete to remove")
	}
	bar := container.NewHBox(
		widget.NewButton("Crosshair", crosshairMode),
		widget.NewButton("Select", selectMode),
	)
	tools := []struct {
		label string
		tool  interact.DrawingToolMode
	}{
		{"H-line", interact.DrawingToolHLine},
		{"V-line", interact.DrawingToolVLine},
		{"Trend", interact.DrawingToolTrendLine},
		{"Ray", interact.DrawingToolRay},
		{"Rect", interact.DrawingToolRectangle},
		{"Channel", interact.DrawingToolChannel},
		{"Fib", interact.DrawingToolFibRetracement},
		{"Text", interact.DrawingToolTextLabel},
		{"Measure", interact.DrawingToolMeasure},
	}
	for _, t := range tools {
		bar.Add(widget.NewButton(t.label, func() {
			setTooltip(priceTip)
			price.SetDrawingTool(t.tool)
			status.SetText("Tool: " + t.label)
		}))
	}
	bar.Add(widget.NewButton("Clear", price.ClearDrawings))

	price.Events.On(interact.EventDrawingCreated, func(evt interface{}) {
		e := evt.(interact.DrawingEvent)
		// Tools stay active after a drawing. The new drawing is selected,
		// so switch to Select mode to let the user move or delete it.
		selectMode()
		status.SetText(fmt.Sprintf("Created %s at %v", e.DrawingID, e.Drawing.DataPoints()))
	})
	price.Events.On(interact.EventDrawingSelected, func(evt interface{}) {
		status.SetText(fmt.Sprintf("Selected %s", evt.(interact.DrawingEvent).DrawingID))
	})
	price.Events.On(interact.EventDrawingDeleted, func(evt interface{}) {
		status.SetText(fmt.Sprintf("Deleted %s", evt.(interact.DrawingEvent).DrawingID))
	})

	w.SetContent(container.NewBorder(container.NewVBox(bar, status), nil, nil, nil, group))
	bellui.ShowAndRun(w)
}